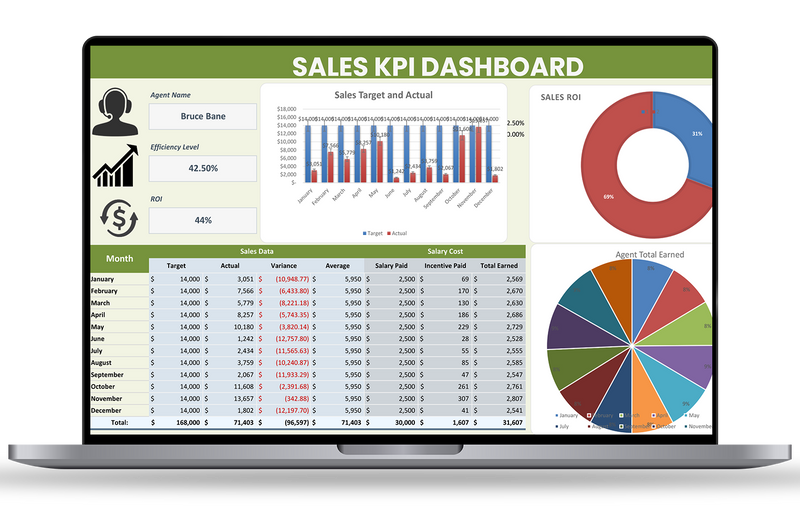
Sales KPI Dashboard Template
sold in last hours
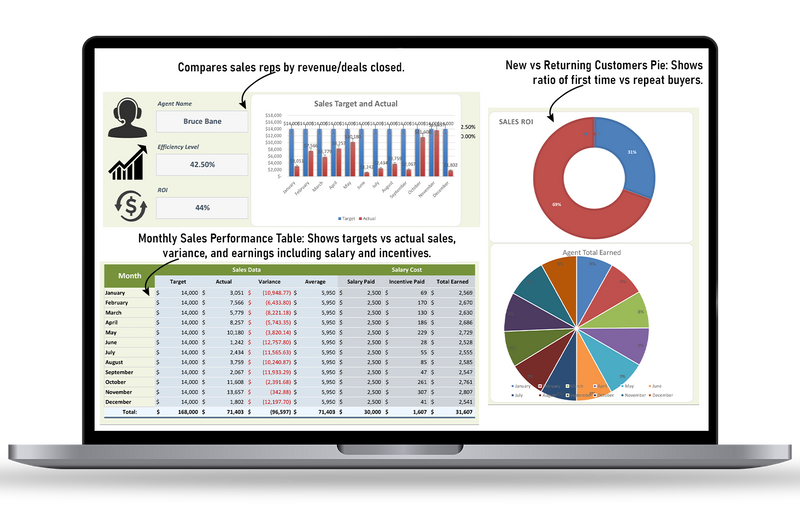
✔ Track sales performance with clear KPI metrics.
✔ Monitor revenue, targets & conversions in real time.
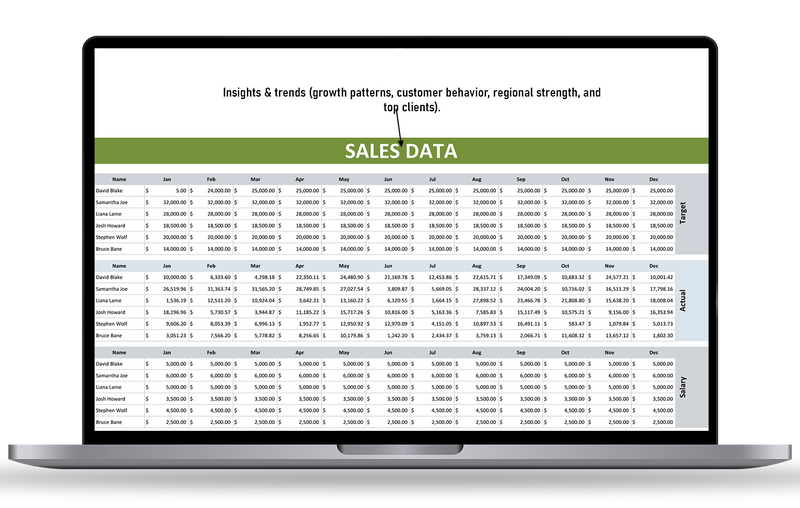
✔ Identify trends to boost sales and improve strategy.
Guarantee safe & secure checkout
Frequently Bought Together
Sales KPI Dashboard Template
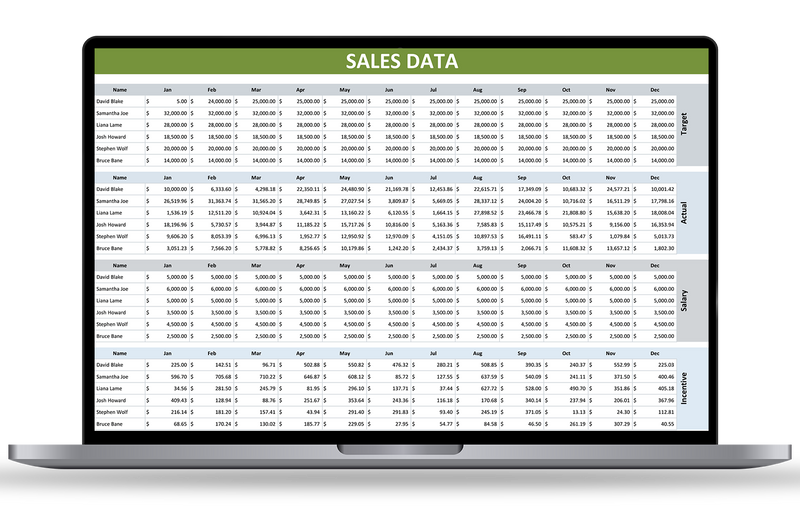
Tabs & Features Analyses
Google Sheets & Excel Version