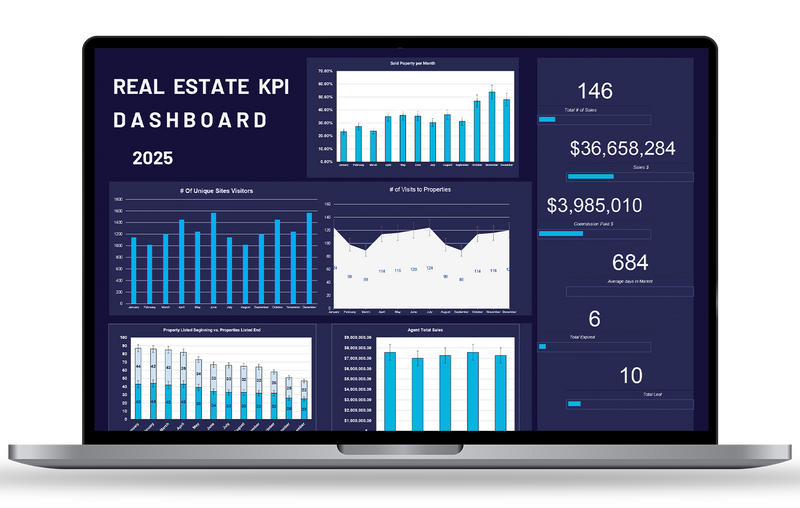
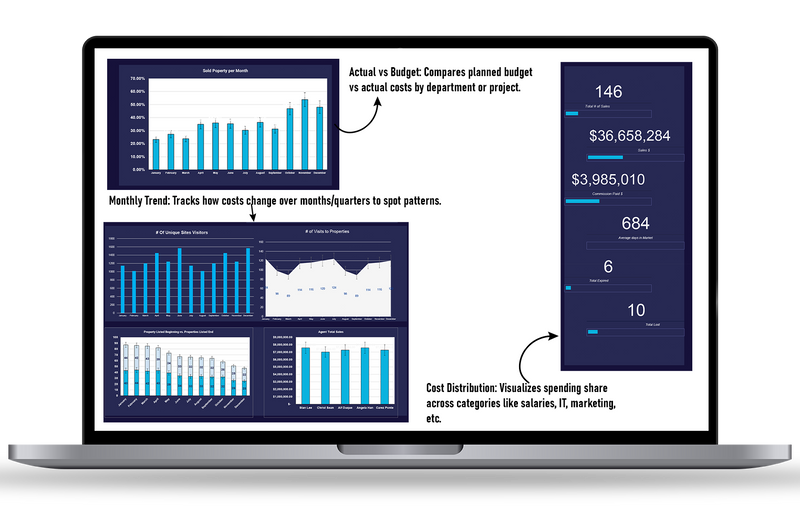
Real Estate KPI Dashboard Template

sold in last hours
$49.00 $25.00

Track key real estate metrics like sales, revenue & occupancy.
Monitor property performance with real time KPIs.
Make data-driven decisions to maximize returns.

Guarantee safe & secure checkout

apple paydiscovergoogle paymasterpaypalshopify payvisa

Frequently Bought Together

Total price:$98.00 $50.00

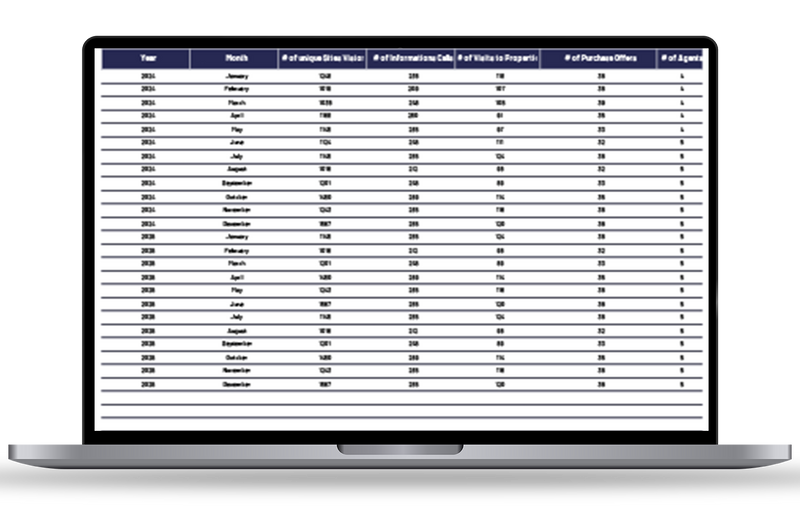
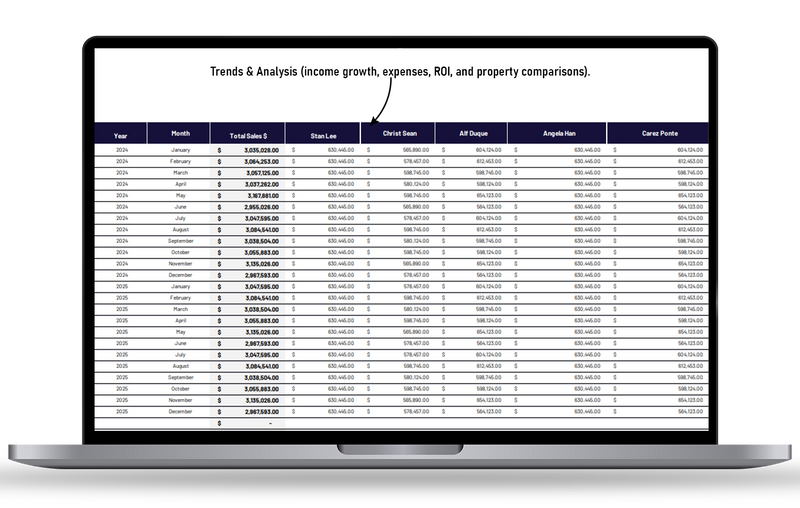
Tabs & Features Analyses

Google Sheets & Excel Version

Dashboard Tab

Real Estate Performance Snapshot

All-in-One Overview: Instantly track sales, revenue, occupancy rates & property performance.

Quick KPIs: Monitor leads generated, closed deals, rental income & property ROI.

Portfolio Comparison: Compare multiple projects, locations & property types side by side.

Real-Time Visualization: KPI cards, charts & graphs auto-update for accurate real estate insights.

Data Input Tab

Centralized Real Estate Data Entry

Structured Logging: Enter property details, sales pipeline data, rental income & operational costs.

Auto-Sync to Dashboard: Inputs directly update KPI cards & portfolio performance charts.

Customizable Fields: Add/edit project names, locations, agents & client details.

Goal Benchmarks: Define sales targets, occupancy goals & ROI benchmarks to measure performance.

Dashboard Insights Tab

Visual Real Estate Analytics

KPI Cards Snapshot: Monitor key metrics like Sales Conversion %, Occupancy Rate, Revenue Growth & Agent Performance.

Comparative Charts: Bar & pie charts display property-wise and project-wise performance.

Trend Analysis: Line charts highlight monthly sales, rental patterns & ROI growth.

Decision-Driven Insights: Spot high-performing properties and optimize investment strategies.

KPI Data Entry Tab

Detailed Property KPI Monitoring

Comprehensive KPI Categories: Track Sales (leads, conversions), Rentals (occupancy %, rent collected), Financials (ROI, expenses), and Agents (deals closed, response time).

Current vs. Target Values: Compare actual metrics against planned goals.

Visual Goal Indicators: Arrows & benchmarks highlight top-performing & underperforming properties.

Actionable Insights: Identify sales gaps, underutilized properties & areas for growth.