Project Mangaement KPI Dshboard Template
sold in last hours
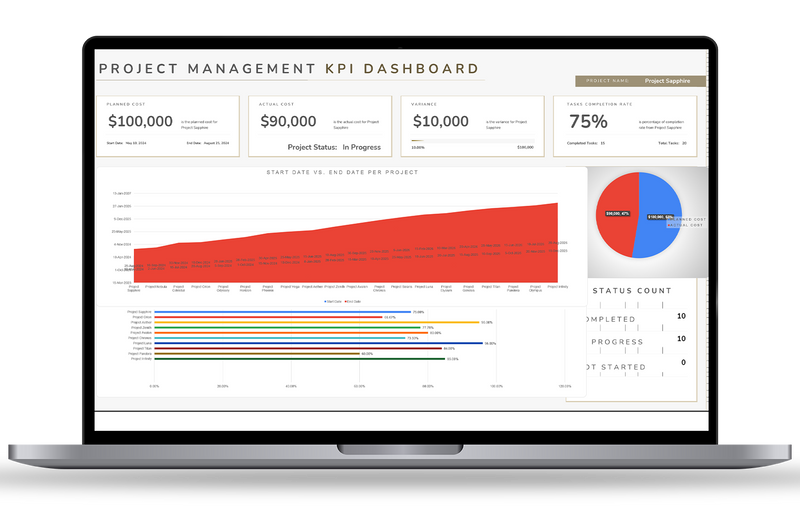
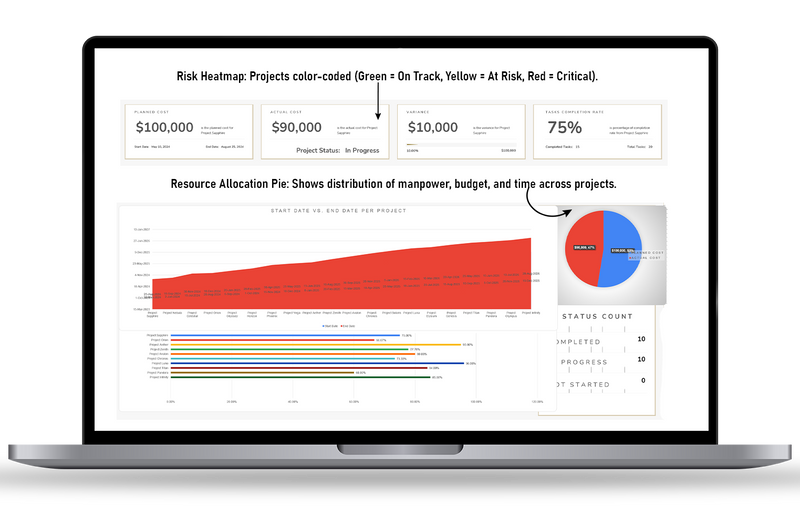
✔ Track project KPIs like timelines, costs & task completion.
✔ Monitor team performance and resource utilization in real-time.
✔ Stay on top of goals with clear project insights.
Guarantee safe & secure checkout
Frequently Bought Together
Project Mangaement KPI Dshboard Template
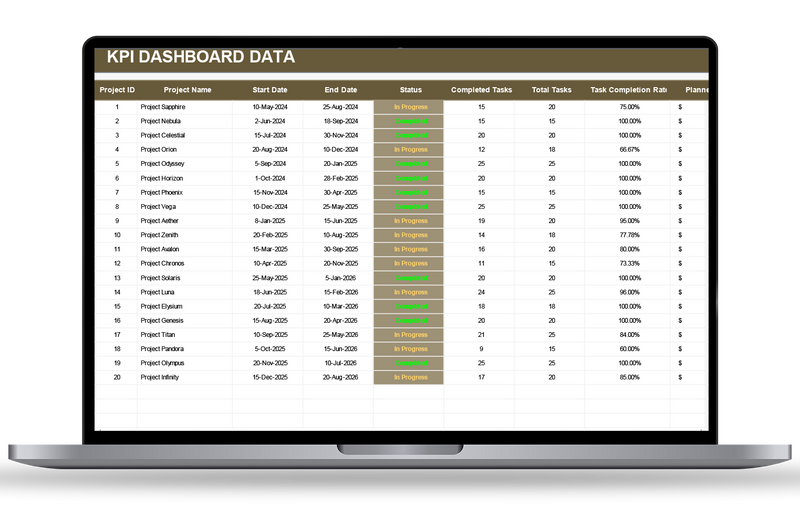
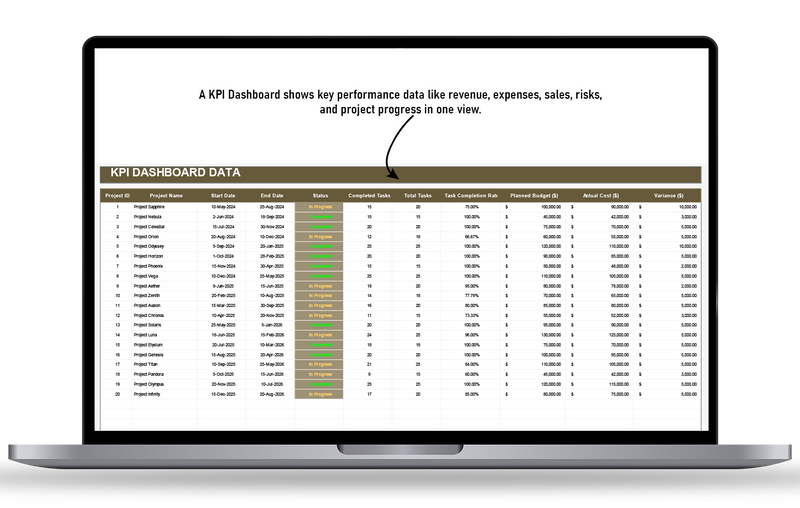
Tabs & Features Analyses
Google Sheets & Excel Version