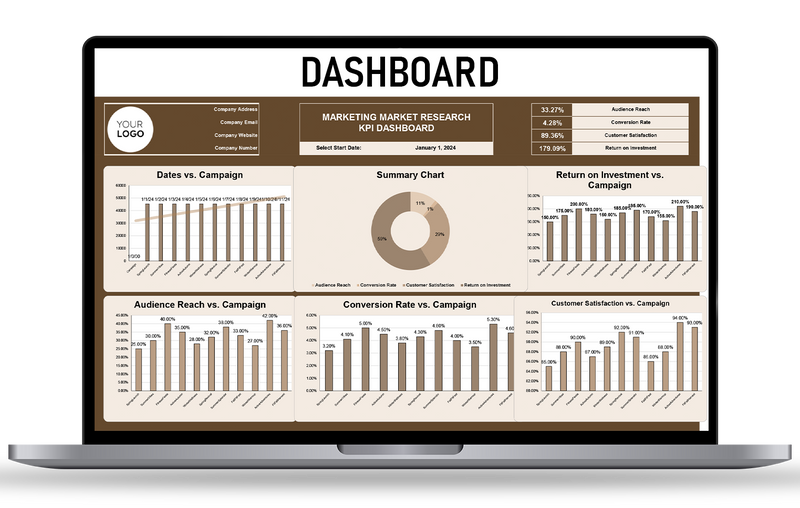
Marketing Market Reserch KPI Dashboard Template

sold in last hours
$49.00 $25.00

Track key marketing and research KPIs in one dashboard.
Measure campaign reach, engagement & audience insights.
Make data driven marketing decisions with real time analytics.

Guarantee safe & secure checkout

apple paydiscovergoogle paymasterpaypalshopify payvisa

Frequently Bought Together

Total price:$98.00 $50.00

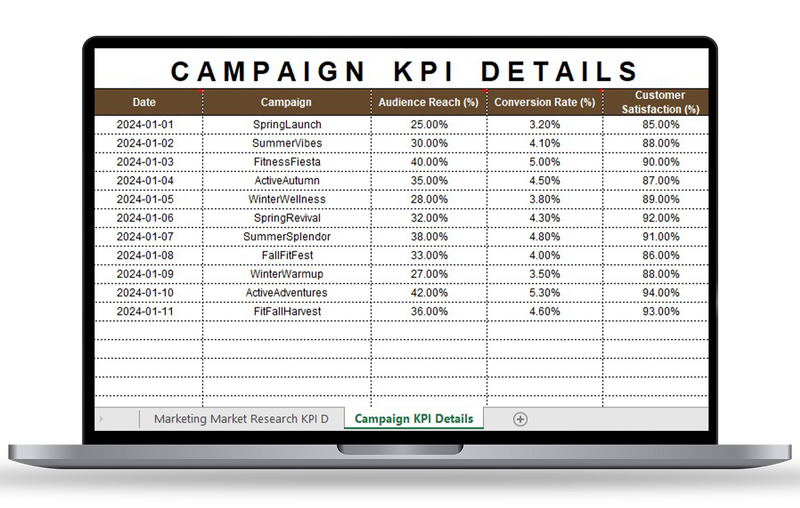
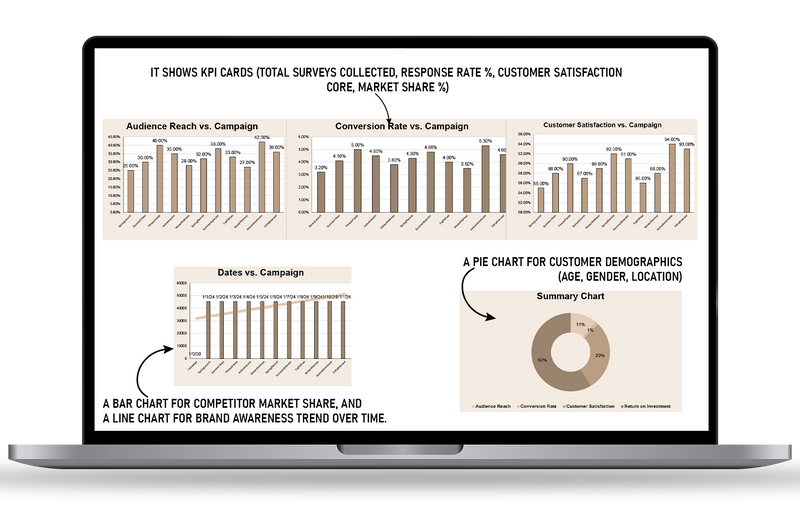
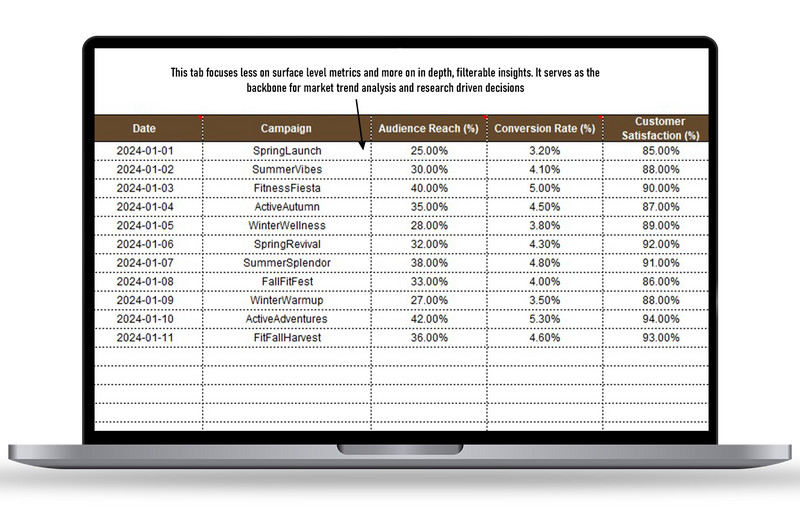
Tabs & Features Analyses

Google Sheets & Excel Version

Dashboard Tab

Market Research Performance Snapshot

All-in-One Overview: Instantly track top-level KPIs like survey response rates, customer insights, and research ROI.

Quick Insights: View demographics, sample size, and segmentation metrics in one glance.

Cross-Channel Analysis: Compare results from surveys, interviews, focus groups, and online polls.

Real-Time Visualization: KPI cards, pie charts, and bar graphs auto-update with every data input.

Data Input Tab

Centralized Research Data Entry

Structured Data Logging: Enter survey responses, interview feedback, and campaign insights.

Auto-Sync to Dashboard: Instantly updates KPI cards & visualization panels for analysis.

Customizable Fields: Add or modify metrics such as gender, age groups, preferences, or buying behavior.

Goal Benchmarks: Define targets for response rate %, sample size, or customer satisfaction scores.

KPI Data Entry Tab

Structured KPI Monitoring

Comprehensive KPI Categories: Track research performance KPIs such as Response Rate, Cost per Respondent, Data Accuracy %, and Market Penetration.

Current vs. Target Values: Compare real-time research results with projected benchmarks.

Visual Goal Indicators: Arrows & progress bars highlight areas meeting, exceeding, or falling short of targets.

Actionable Benchmarking: Identify low-response areas or underrepresented segments for deeper research.

Dashboard Insights Tab

Visual Research Data Overview

KPI Cards Snapshot: Track core metrics like Survey Completion %, Cost Efficiency, Satisfaction Scores & Data Coverage.

Comparative Charts: Analyze consumer behavior and preferences across multiple demographic groups.

Trend Visualizations: Line charts show response trends, while bar graphs compare audience segments.

Action-Driven Insights: Highlight patterns, gaps & opportunities to refine marketing strategies.