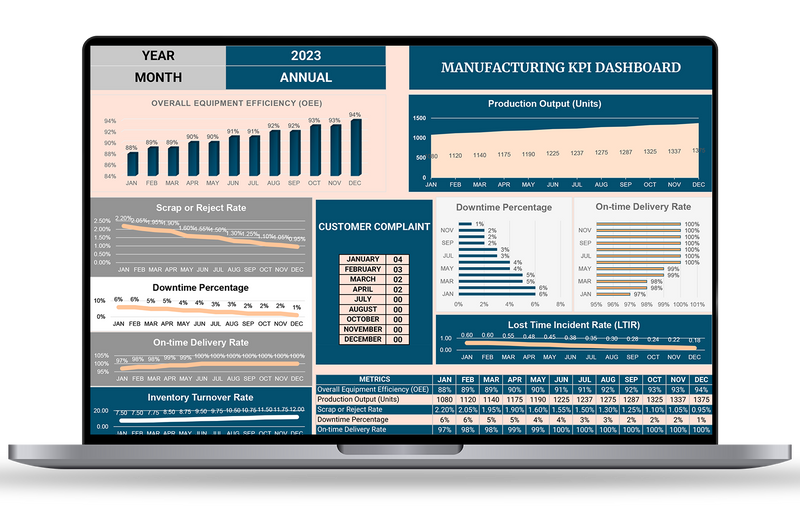
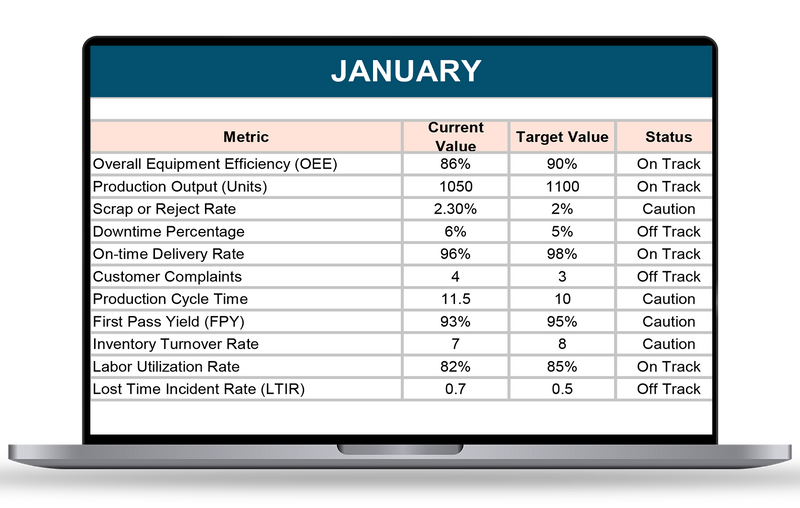
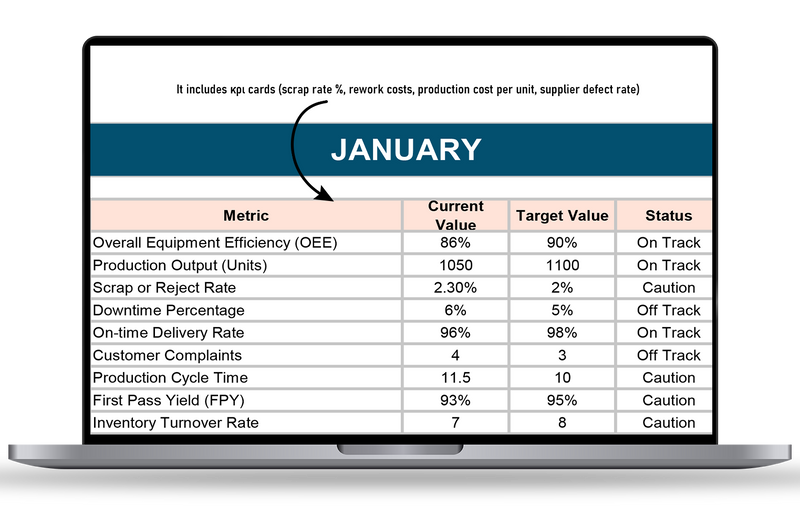
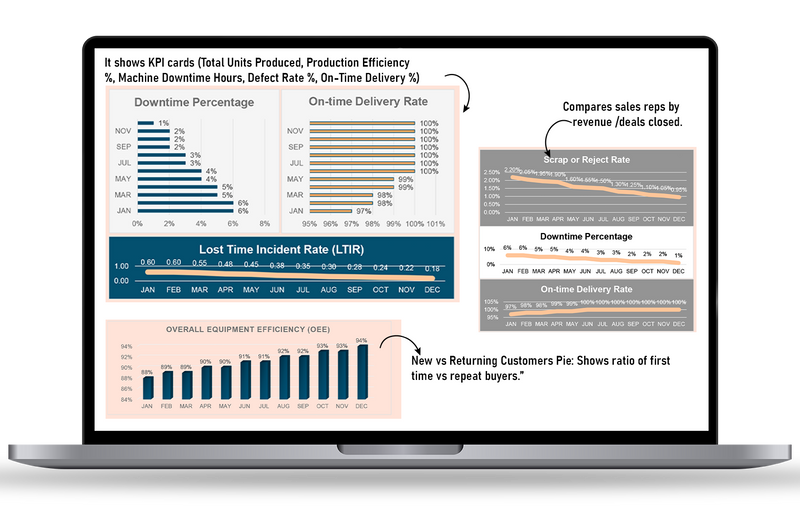
Manufacturing KPI Dashboard Template

sold in last hours
$49.00 $25.00

Monitor production efficiency, quality, and output in one place.
Track downtime, costs & resource utilization with real time KPIs.
Improve decision-making with clear manufacturing performance insights.

Guarantee safe & secure checkout

apple paydiscovergoogle paymasterpaypalshopify payvisa

Frequently Bought Together

Total price:$98.00 $50.00

Tabs & Features Analyses

Google Sheets & Excel Version

Dashboard Tab

Manufacturing Performance Snapshot

All-in-One Overview: Instantly track production efficiency, downtime %, defect rate, and output trends.

Quick KPIs: Monitor real-time insights like units produced, cycle time, and on-time delivery rate.

Cross-Department Metrics: Compare performance across production, quality control, maintenance, and supply chain.

Real-Time Visualization: KPI cards, line charts & bar graphs auto-update with each data entry.

Data Input Tab

Centralized Production Data Entry

Structured Data Logging: Enter production volumes, machine hours, downtime, and material usage.

Auto-Sync to Dashboard: Instantly feeds into KPI cards and dashboards for accurate monitoring.

Customizable Fields: Add or modify categories like defect reasons, production lines, or shift performance.

Goal Benchmarks: Define targets for efficiency %, defect reduction, or delivery timeliness.

KPI Data Entry Tab

Detailed KPI Monitoring

Comprehensive KPI Categories: Track metrics like Production Efficiency, Downtime %, Defect Rate, OEE (Overall Equipment Effectiveness), and Supply Chain Performance.

Current vs. Target Values: Instantly compare actual performance with organizational goals.

Visual Goal Indicators: Progress arrows and benchmarking visuals highlight strengths and gaps.

Actionable Metrics: Identify bottlenecks in production or quality to improve overall performance.

Dashboard Insights Tab

Visual Manufacturing Analysis

KPI Cards Snapshot: Monitor Production Output, OEE %, On-Time Delivery Rate, and Quality Index at a glance.

Comparative Charts: View line, bar & pie charts for defect categories, downtime reasons, and department efficiency.

Trend Analysis: Spot monthly production growth, defect trends, and downtime reductions.

Decision-Driven Insights: Pinpoint areas of underperformance and optimize manufacturing processes.