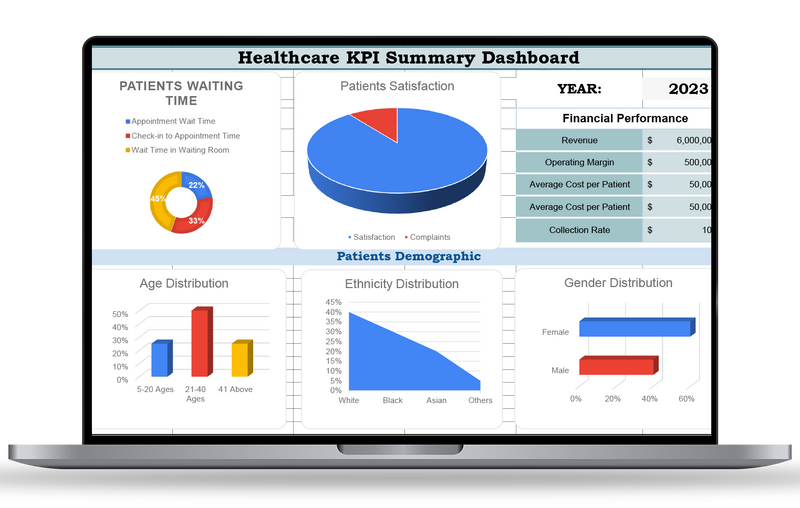
Health Care KPI Dashboard Template

sold in last hours
$49.00 $25.00

Monitor key healthcare metrics like patient care, efficiency & costs.
Track hospital/clinic performance with real time KPIs.
Improve decision-making with clear, data driven insights.

Guarantee safe & secure checkout

apple paydiscovergoogle paymasterpaypalshopify payvisa

Frequently Bought Together

Total price:$98.00 $50.00

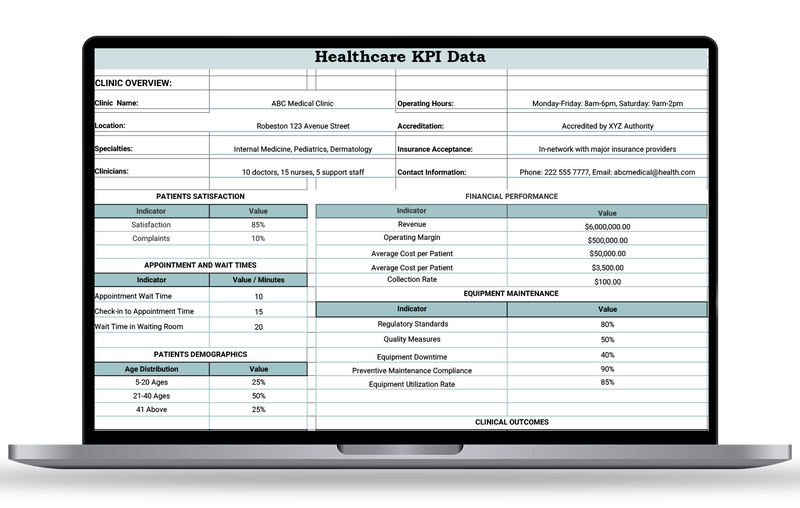
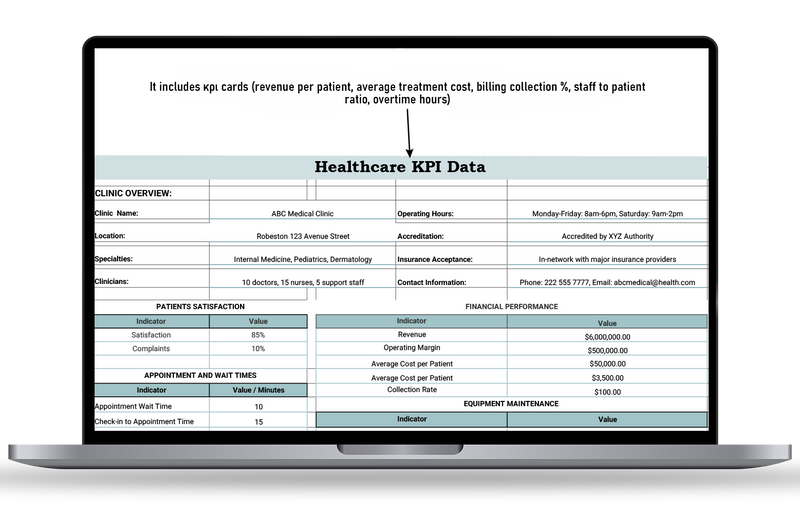
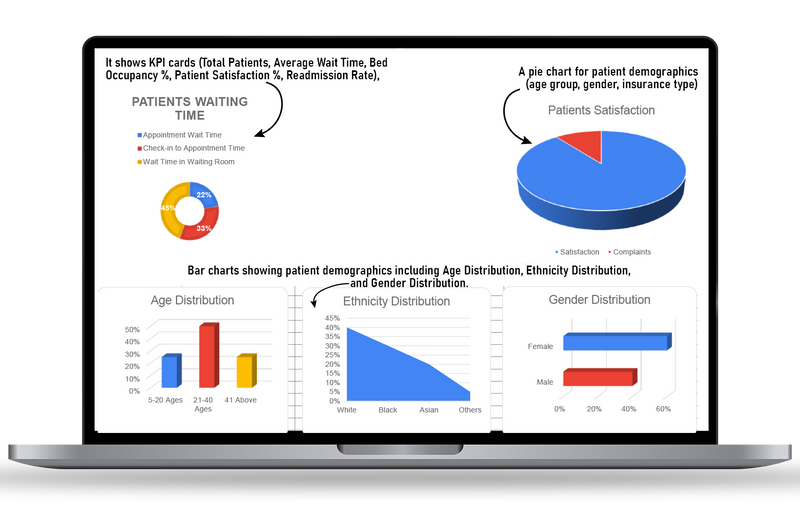
Tabs & Features Analyses

Google Sheets & Excel Version

Dashboard Tab

Sales Performance Snapshot

All-in-One Overview: Instantly track revenue, sales growth %, average deal size & win rate.

Quick KPIs: Monitor leads converted, opportunities closed, and sales pipeline health.

Cross-Segment Insights: Compare performance across products, sales reps & regions.

Real-Time Visualization: KPI cards, bar charts & line graphs auto-update with every data entry.

Data Input Tab

Centralized Sales Data Entry

Structured Logging: Input patient volumes, treatment records, staff data & operational costs.

Auto-Sync to Dashboard: All entries directly update KPI cards & performance charts.

Customizable Fields: Add or edit metrics like department name, patient type & medical procedures.

Goal Benchmarks: Define targets for patient satisfaction, treatment efficiency & cost management.

KPI Data Entry Tab

Detailed Sales KPI Monitoring

Detailed Healthcare KPI Monitoring

Comprehensive KPI Categories: Track Patient Care (satisfaction, safety), Operations (bed occupancy, wait times), Finance (cost per patient), and Staff (training hours, turnover %).

Current vs. Target Values: Compare actual results with defined hospital or clinic goals.

Visual Goal Indicators: Arrows & benchmarks highlight areas needing immediate attention.

Actionable Insights: Identify gaps in service quality, operational bottlenecks & resource allocation.

Dashboard Insights Tab

Visual Healthcare Analytics

KPI Cards Snapshot: Monitor vital indicators like Patient Satisfaction %, Bed Occupancy Rate, Average Treatment Time & Staff Utilization %.

Comparative Charts: Bar & pie charts showcase departmental performance and resource distribution.

Trend Analysis: Line graphs track admissions, discharge rates & treatment outcomes over time.

Decision-Driven Insights: Highlight underperforming areas to improve healthcare delivery & patient care.