Forecast Dashboard Template
sold in last hours
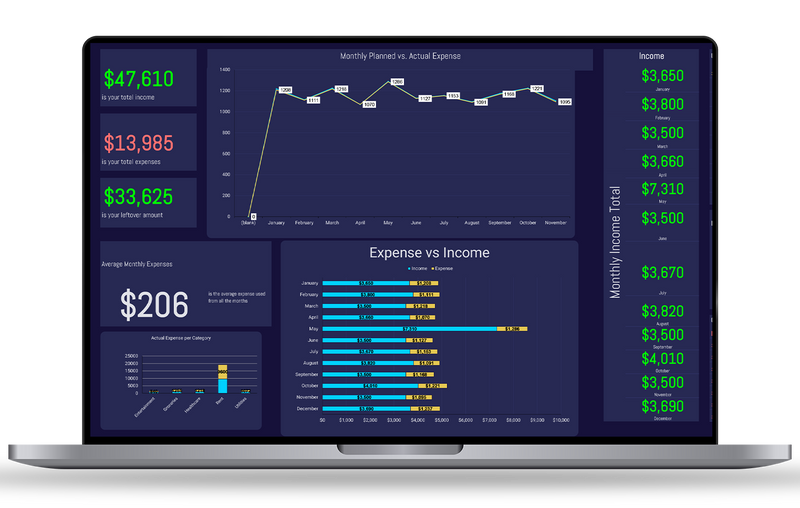
✔ Visualize future trends with clear, data driven forecasts.
✔ Track sales, revenue & performance projections in real time.
✔ Plan smarter with accurate insights for better decision making.
Guarantee safe & secure checkout
Frequently Bought Together
Forecast Dashboard Template
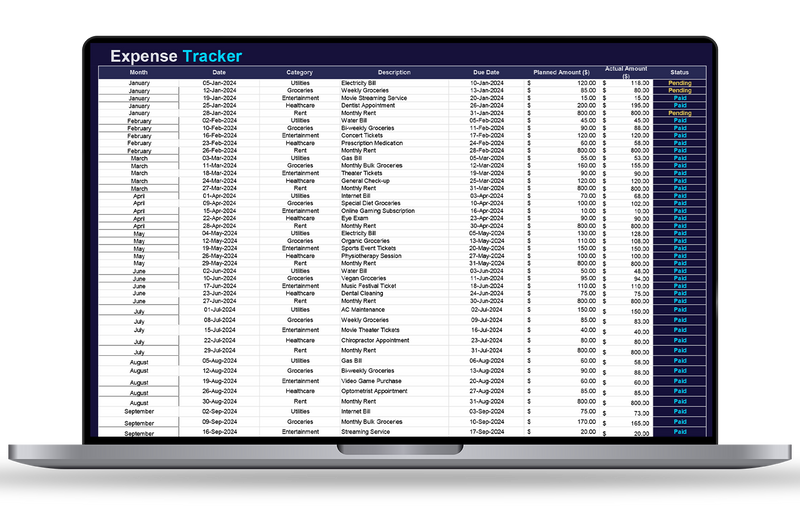
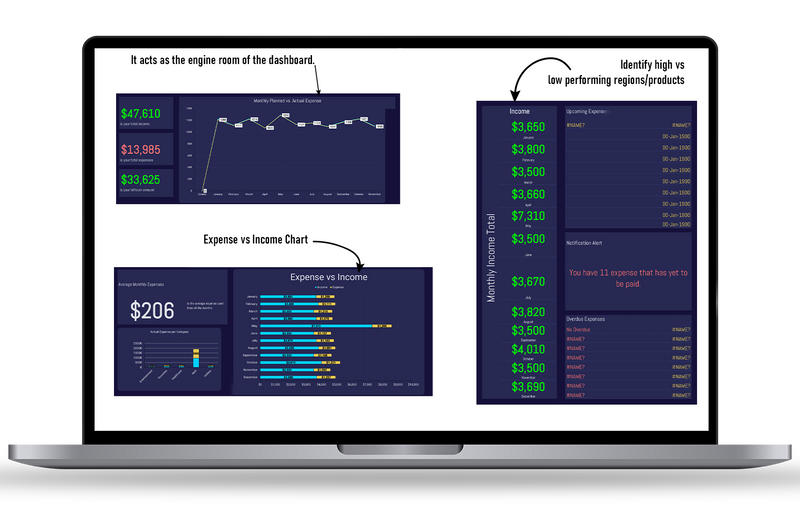
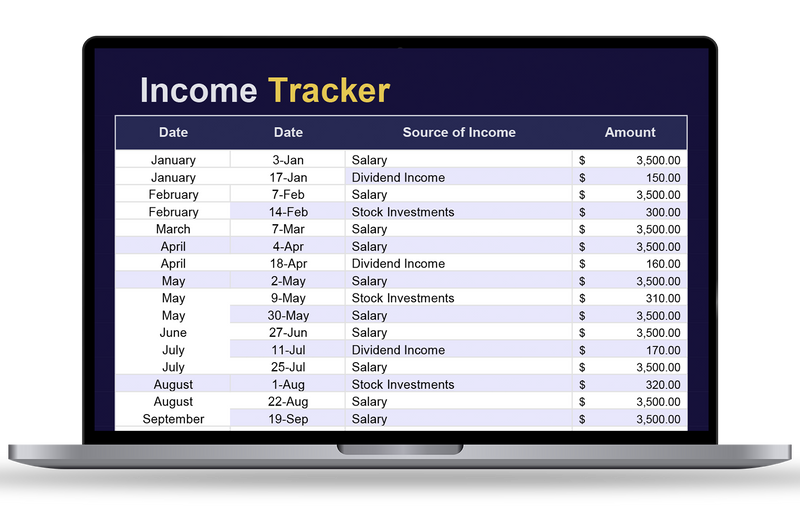
Tabs & Features Analyses
Google Sheets & Excel Version