Financial Cost Management Dashbard Template
sold in last hours
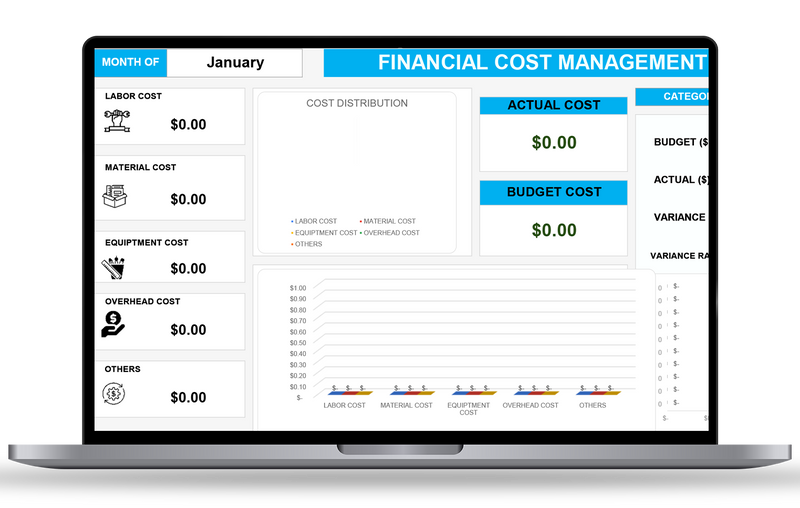
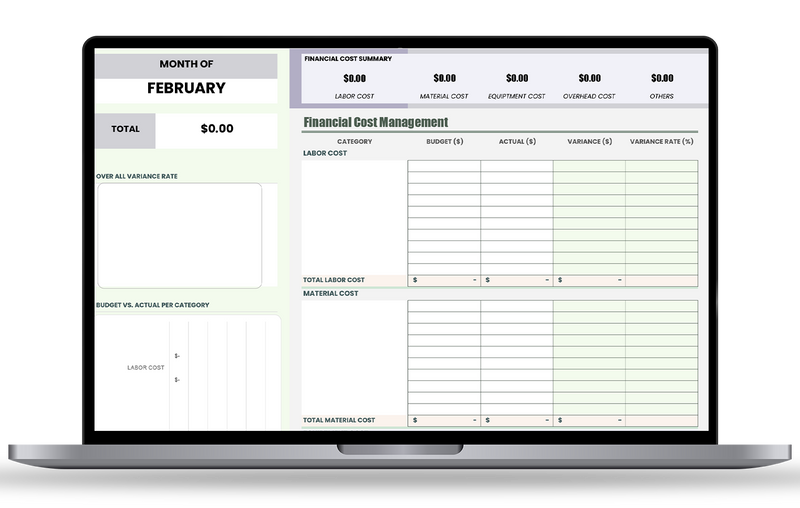
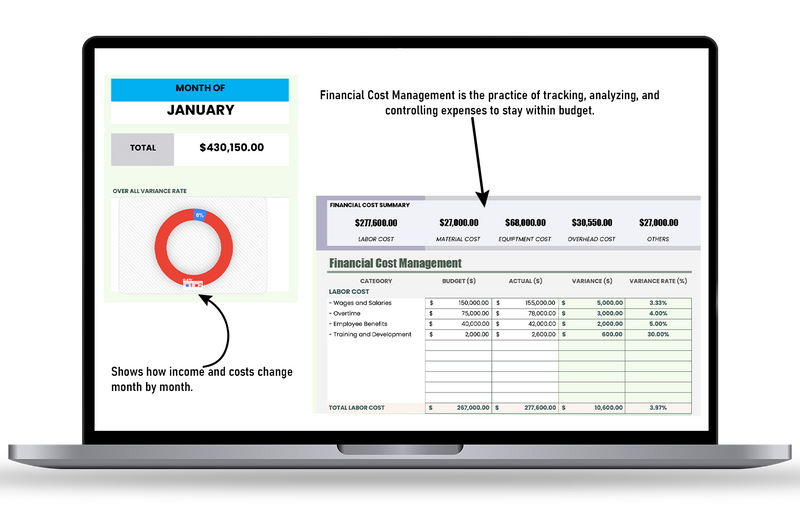
✔ Monitor and control business costs in one centralized dashboard.
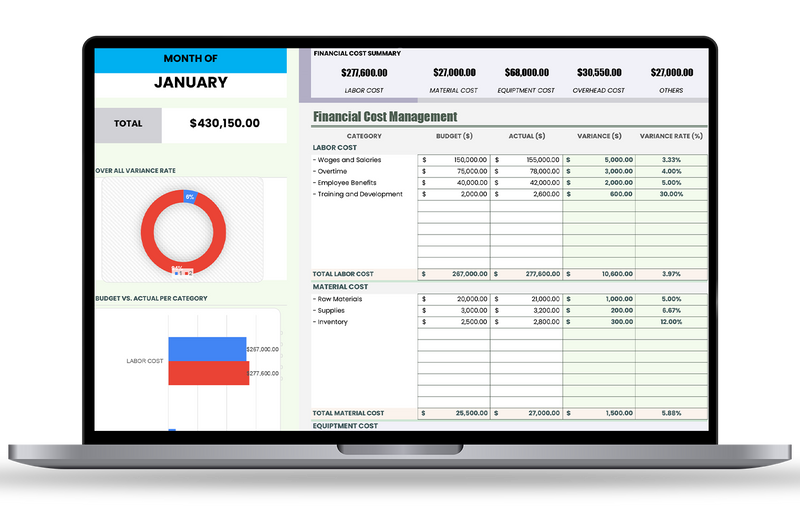
✔ Track expenses, budgets & variances in real time.
✔ Optimize resources and reduce unnecessary spending.
Guarantee safe & secure checkout
Frequently Bought Together
Financial Cost Management Dashbard Template
Tabs & Features Analyses
Google Sheets & Excel Version